
Let’s see what wizard is helping us to identify the causes of the blocking and slowness. A few years ago, Google released its own web performance analyser tool PageSpeed Insights.
PageSpeed Insights (PSI) gives you user experience reports for both mobile and desktop devices. It also provides suggestions on what can be improved and how.
Some of the parameters that the PSI tool provides and their thresholds are shown in the table below:
|
|
Good |
Moderate |
Slow |
|
FCP (s) |
0 – 1.8 |
1.8 – 3 |
Over 3 |
|
SI (s) |
0 – 3.4 |
3.4 – 5.8 |
Over 5.8 |
|
LCP (s) |
0 – 2.5 |
2.5 – 4 |
Over 4 |
|
TTI (s) |
0 – 3.8 |
3.8 – 7.3 |
Over 7.3 |
|
TBT (ms) |
0 – 200 |
200 – 600 |
Over 600 |
|
CLS |
0 – 0.1 |
0.1 – 0.25 |
Over 0.25 |
FCP – First Contentful Paint is a crucial performance metric that measures the time it takes for the first place of content (such as text, images, or other elements) to appear on a web page after a user initiates navigation. It provides insights into how quickly a user perceives visual content loading on the page.
SI – Speed Index is an interesting metric when considering page speed. It provides insights into how quickly your web page loads above the fold, which means the visible portion of the page without scrolling.
LCP – Large Contentful Page is a crucial performance metric used to measure the perceived load speed of a web page. It specifically focuses on the visual loading experience for the largest content element becomes visible within the user’s viewport during page load.
TTI – Time to Interactive is one of the performance metrics tracked in the Lighthouse report, which assesses various aspects of page load speed. TTI specifically measures how long it takes for a web page to become fully interactive.
TBT – Total Blocking Time is a crucial metric when it comes to assessing website performance, particularly in the context of Google’s PageSpeed Insights. Along with the Largest Contentful Paint (LCP), TBT significantly impacts the overall PSI score.
CLS – Cumulative Layout Shift is a metric that evaluates the visual stability of a web page as it loads. It measures how much elements shift unexpectedly during the loading process. CLS is one of the three Core Web Vitals metrics used by Google to assess page experience.
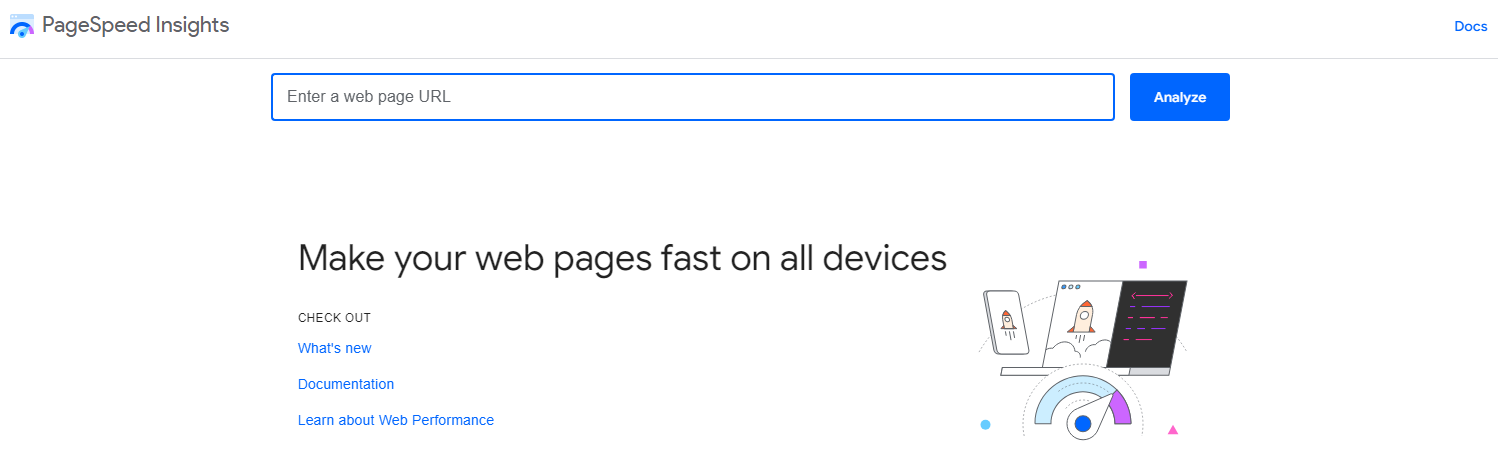
Google provides two ways of using Pagespeed Insights:
- Webpage – easy to use to quickly check a few pages. Just enter the correct web page URL, click Analyze, and wait for the results.
- PageSpeed API – optimal for bulk URLs
Automated script using Pagespeed API
Using Pagespeed API is one of the ways to get information about the web page’s health. Everything you need is page URL and strategy (Mobile or Desktop).
Some optional parameters will make your response more relevant.
Those parameters are API Key, Google OAuth 2.0 (if your page is secured by Google OAuth 2.0), Captcha token, Category (Accessibility, Best practices, Performance, PWA, SEO), and locale.
Example of the method which will give the results from the response by triggering API:.png?width=760&height=387&name=image1.1.1.%20(1).png)
At the beginning of the method, the script for getting a response has been put into the loop with 3 iterations. Results of all the Pagespeed response relevant parameters are divided by 3 which means that the average result has been taken.
The result object has been written into the .csv file and the results are available for analysis.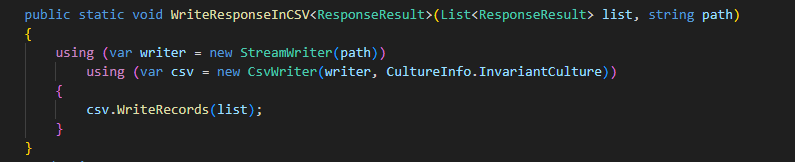
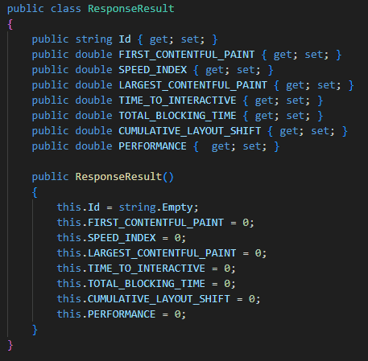
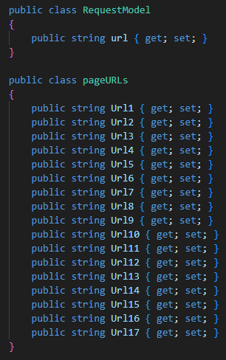
The request model and response model are written as follows:
|
|
Benefits of using webpage and API PageSpeed Insights
Let’s explore the benefits of using PageSpeed Insights, both webpage and API:
- Webpage benefits:
- Performance measurement: PageSpeed Insights helps you measure the performance of the web page. It provides valuable insights into how quickly your page loads and identifies areas for improvement.
- Accessibility and SEO Suggestions: The tool offers suggestions on how to enhance your page’s performance, accessibility, and SEO. Implementing these recommendations can lead to a better user experience and improved search engine rankings.
- Progressive Web App (PWA) Conversion: PageSpeed Insights guides you on how to convert your page into a Progressive Web App (PWA). PWAs offer enhanced user engagement, offline capabilities, and faster load times.
- API benefits:
- Real-World Data: The PageSpeed Insights API provides real-world data from the Chrome User Experience Report and lab data from Lighthouse. This data helps you understand how actual users experience your site.
- Automated Monitoring: You can automate page runs using the API, allowing you to monitor performance over time. This is useful for tracking changes and ensuring consistent optimization.
- Customized Information: With the API, you can display specific information relevant to your needs. Whether you are reviewing changes after updates or analysing long-term trends, the API allows flexibility in displaying the exact data you require.
Summary
In summary, PageSpeed Insights empowers you to optimize your web pages for better performance, accessibility, and user satisfaction, whether you’re using the web interface or the API.

.jpg)